Stellar
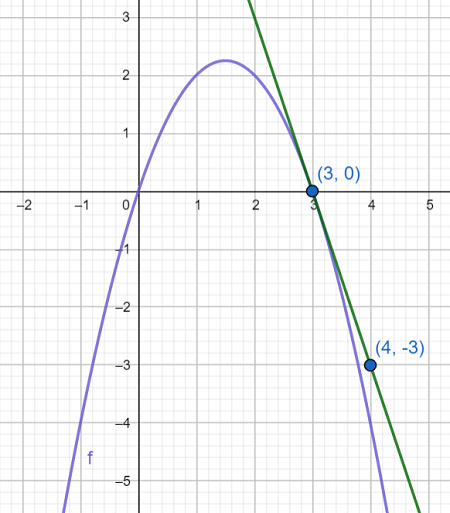
Sometimes we are not given an explicit formula for a function, but we still want to estimate its derivative at a point. In these cases, we can use a table of values, a graph, or nearby secant slopes. Since the derivative is the limit of average rates of change, we estimate it by choosing points very close to the target x-value and computing the slope between them. If the slopes from the left and the right approach the same value, that value is a good estimate of the derivative.
This lesson emphasizes that derivatives are not only found symbolically. They can also be approximated numerically and graphically. A table might show that the secant slopes near a point are stabilizing around a number, or a graph might suggest the tangent line has a certain slope. This is important because AP Calculus often asks students to interpret derivatives from multiple representations rather than only compute them from formulas.