 Stellar
When estimating limits from graphs, the most important thing is to focus on the y-values the graph approaches as x moves toward a point. You should mentally trace the graph from the left side and then from the right side. If both sides move toward the same y-value, then the limit exists and equals that number. A filled dot, open circle, or missing point may affect the function value, but it does not by itself determine the limit.
Graphs help students clearly distinguish between a limit and a function value. A graph may have a hole where the function is not defined, but if both sides approach the same number, the limit still exists. On the other hand, if the left and right sides approach different numbers, then the graph has no two-sided limit there. This is why graph-based limit questions always require checking both sides carefully.
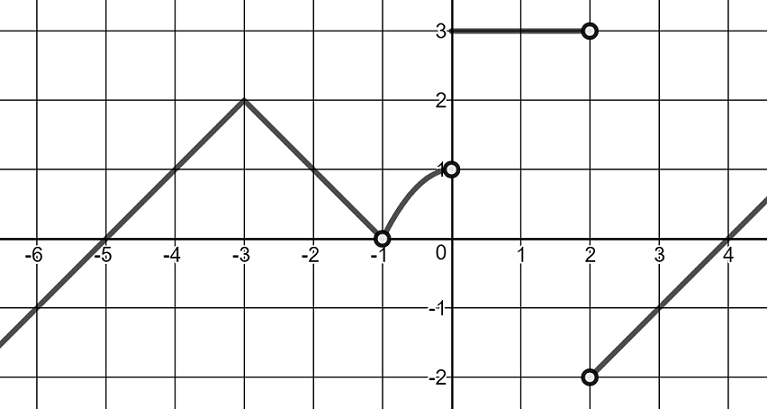
Example 1:
Using the image above, what is the limit of the function f(x) as x approaches -1?
Since the right and left hand limits both are 0, the limit of f(x) as x approaches -1 must be .