Stellar
Particulate Equilibrium Diagrams
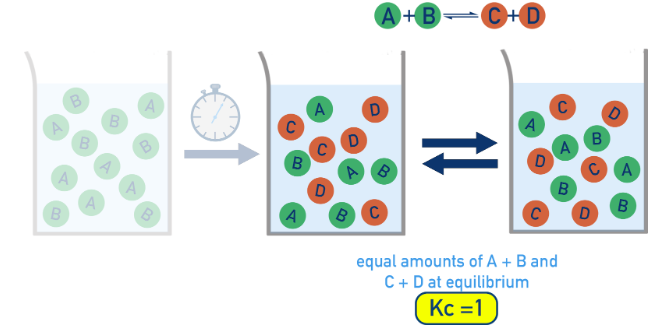
|Particulate diagrams can represent the relative amount of reactants and products in a solution or in a container of gas at equilibrium. These diagrams require you to understand both the equilibrium constant and the stoichiometry of the reaction that is occurring. In the case of the equilibrium constant, a low value will indicate that the final solution has a majority of reactants, while a high value indicates that the solution has a majority of products. For stoichiometry, if a reaction starts with only reactants and goes to products, the products will have to be in the same molar ratio as their coefficients.