Stellar
Energy Diagrams
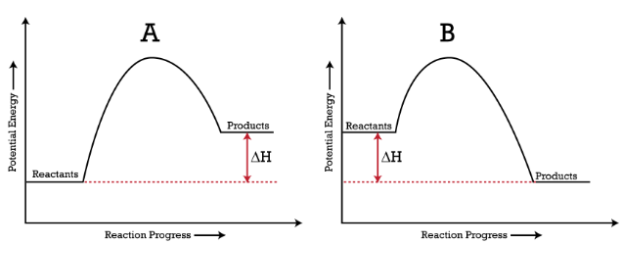
Energy diagrams help show the energy of the reactants compared to the products of a chemical reaction. These diagrams have energy on the y-axis and time on the x-axis. At the start, the chemical reaction shows the energy of the reactants. After a long time, the reaction shows the energy of the products. If the products have more energy than the reactants, then the reaction is endothermic, and if the reactants have more energy than the products, then the reaction is exothermic. The change in energy is known as the enthalpy of the reaction, which will be discussed in future subunits.